The Data Driven Leader by Jenny Dearborn & David Swanson
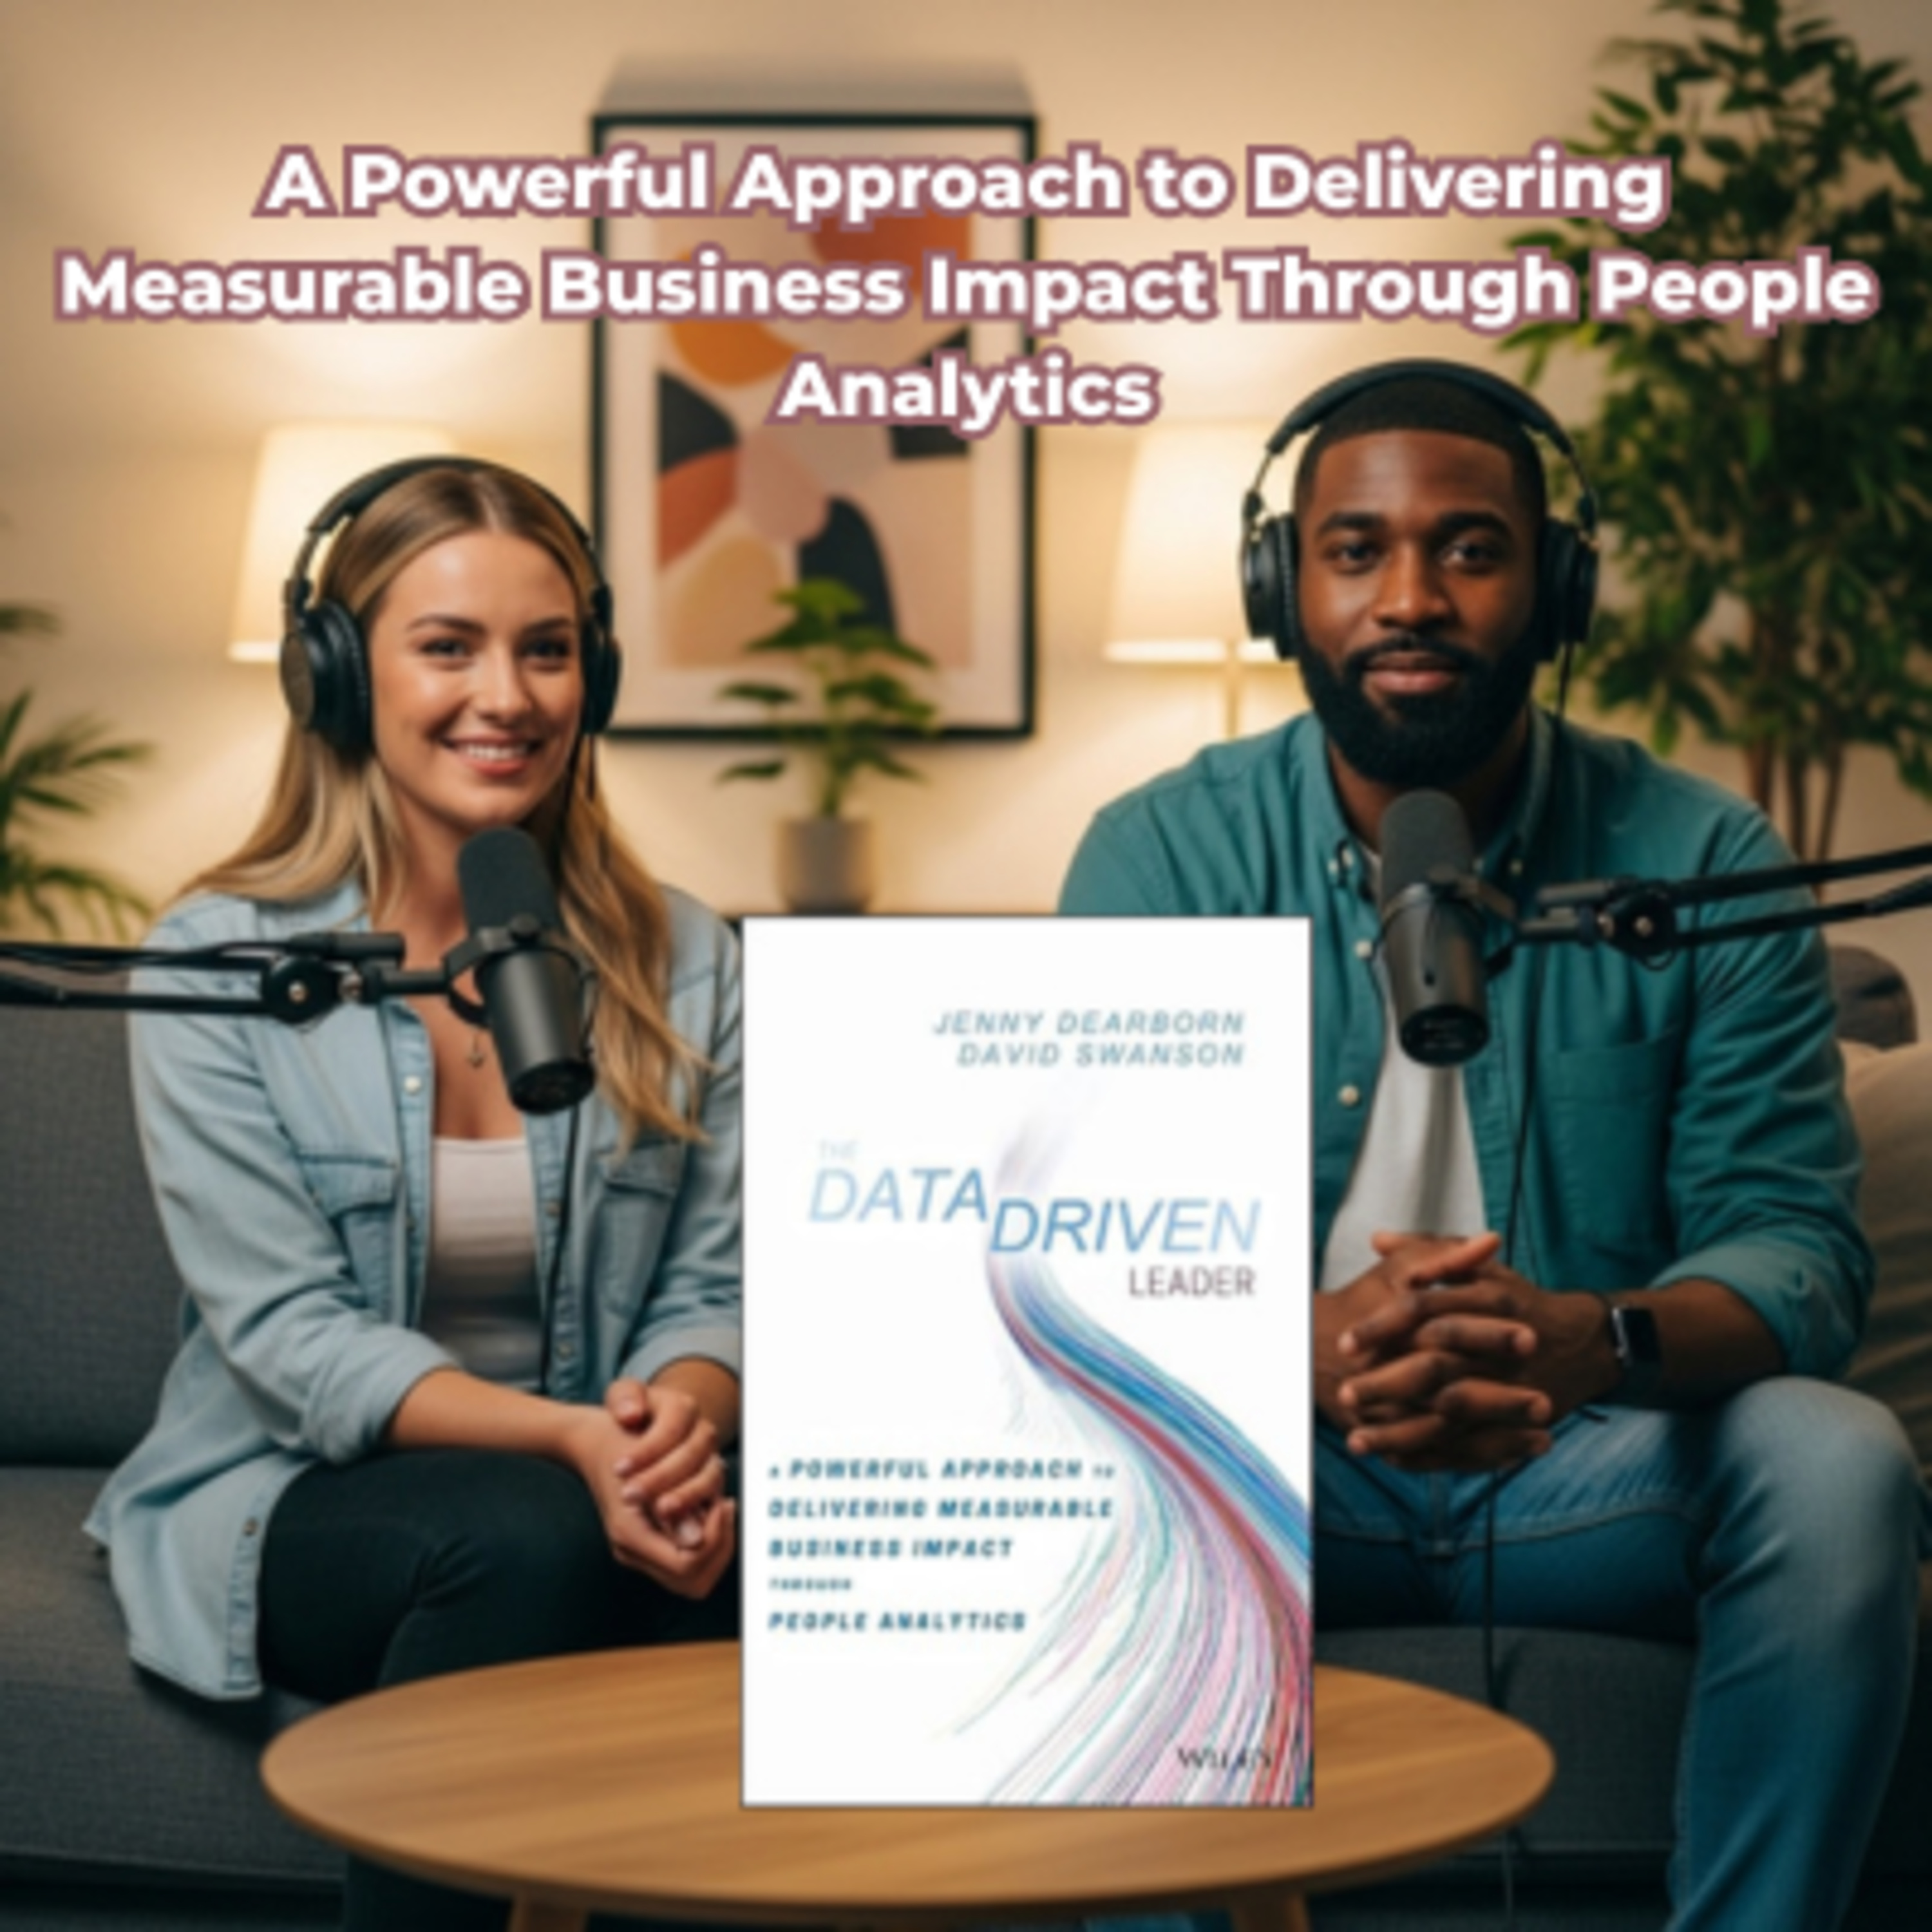
The Data Driven Leader presents a clear, accessible guide to solving important leadership challenges through human resources-focused and other data analytics. This engaging book shows you how to transform the HR function and overall organizational effectiveness by using data to make decisions grounded in facts vs. opinions, identify root causes behind your company’s thorniest problems and move toward a winning, future-focused business strategy. Realistic and actionable, this book tells the story of a successful sales executive who, after leading an analytics-driven turnaround (in Data Driven, this book’s predecessor), faces a new turnaround challenge as chief human resources officer. Each chapter features insightful commentary and practical notes on the points the story raises, guiding you to put HR analytics into action in your organization.
HR and other leaders cannot afford to overlook the power and competitive advantages of data-driven decision-making and strategies. This book reflects the growing trend of CEOs choosing analytics-minded business leaders to head HR, at a time when workplaces everywhere face game-changing forces including automation, robotics and artificial intelligence. It is urgent that human resources leaders embrace analytics, not only to remain professionally relevant but also to help their organizations successfully navigate this digital transformation. HR professionals can and must:
- Understand essential data science principles and corporate analytics models
- Identify and execute effective data analytics initiatives
- Boost HR and company productivity and performance with metrics that matter
- Shape an analytics-centric culture that generates data driven leaders
Most organizations capture and report data, but data is useless without analysis that leads to action. The Data Driven Leader shows you how to use this tremendous asset to lead your organization higher.
#TheDataDrivenLeader #PeopleAnalytics #HRAnalytics #DataDrivenLeadership #BusinessLeadership #LeadershipDevelopment #DataDrivenDecisionMaking #WorkforceAnalytics #BusinessStrategy #HumanResources #LeadershipSkills #BookSummary #BusinessGrowth #FutureOfWork #OrganizationalDevelopment
Imagine you are standing in the the very center of a packed stadium. There are 50,000 people around you. They're all shouting at the exact same time. And your job, your one and only job, is to pick out a single useful sentence from that wall of sound. That sounds absolutely terrifying. Right. I mean that feeling of complete paralyzing overwhelm. That is exactly what it feels like for most of us when we look at the sheer amount of information generated by our comanies every single day. We are drowning in numbers.
But we are, you know, completely starving for actual insight. Yeah, it's a well, it's a profoundly common struggle. Having more information does not automatically equate to having more clarity. In fact, if you lack a framework to process it, an abundance of data usually results in the exact opposite. It just makes things worse. Exactly. It creates this cognitive bottleneck where leaders become completely paralyzed. They're unable to make a call because there is always, you know, one more dashboard to check or one more report to run.
And that paralysis is exactly what we're dismantling today. Welcome to this deep dive. We are exploring the core mechanics of a book called The Data-driven Leader by Jenny Dearborn and David Swanson. It's a fantastic resource. It really is, and the mission here is to shortcut all that noise. We are going to extract a highly practical step by step method for taking all that raw organizational information and transforming it into real world business effects for you, whether that means sharper decision making, better employee engagement, or ultimately just building a more resilient organization.
And a critical first step in doing that is, well, we have to fundamentally redefine our vocabulary. OK, let's unpack this because I think a lot of people get tripped up on the word data. Oh absolutely. When you hear the word data, the immediate mental image is usually like a massive spreadsheet filled with financial figures or maybe some complex analytics dashboard tracking user clicks. The wall of Math. Right, exactly. But if we limit our definition to just hard connotative math, we miss the forest for the trees.
Dearborn and Swanson argue that data is simply a tool. It's a tool used to accomplish a practical business objective. Yeah, I always look at raw data like a like a massive unedited audio file of a live concert. On its own, it's just a chaotic wall of sound. You know, the vocals, the drums, the crowd noise, it's all bleeding together. Just noise until you process it. Right, it is completely useless until you put it through an equalizer board and actively isolate the specific track you want to listen to.
You have to mold that raw file toward a specific goal. And in a business context, one of the most fascinating ways the authors do this is by quantifying human behavior. Yeah. Which brings us to something they call stay interviews. Yes, which is a brilliant example of people analytics in action. I mean, we are all familiar with the exit interview, right? Oh yeah, the awkward chat on your last day. Exactly, which is essentially a post mortem. It happens when an employee is already walking out the door, meaning it's far too late to fix the problem.
A stay interview, on the other hand, is an active, structured conversation a manager has with a current employee to extract qualitative data. So you're asking them why they haven't quit yet? Basically, yeah, you are trying to understand the specific variables that cause them to stay and the friction points that might, you know, eventually cause them to leave. But wait, how do you actually turn a conversation into usable data? I mean, if an employee just says I feel stressed, that is a qualitative feeling.
How does our metaphorical equalizer board isolate the signal from a feeling? Well, you map that qualitative sentiment against your quantitative metrics. That's how you find the actual mechanism causing the stress. Let's look at a scenario the author's outline. Suppose you oversee a customer support team. You're looking at your performance dashboard and the data shows that response times are dragging. They are getting exponentially longer. Every managers nightmare and the immediate gut reaction is usually to assume that the team is slacking off so you fire off an e-mail telling everyone they need to work faster and close tickets quicker.
Right. And that reaction? It treats the symptom while completely ignoring the disease. If you actually cross reference those slow response times with the data you gathered from your stay interviews where employees explicitly reported feeling overwhelmed, and then you map both of those against your daily ticket volume, a structural failure reveals itself. I see where this is going. The raw data told you the times were slow. The integrated data reveals that your staff is completely overworked because the ticket volume has just outpaced your current shift scheduling.
Wow. So the numbers are literally just a symptom of a human bottleneck. Precisely. So the solution is not behavioral. You don't need to yell at the team to type faster. The solution is structural. Based on that mapped data, you can definitively justify the budget to, say, strengthen the ticketing software itself, or maybe recruit targeted support professionals for those specific super busy shifts. And then the stress goes down. Exactly. You solve the structural issue and as a result your staff experiences less stress, the reaction times naturally drop and customer happiness rises.
You have taken an abstract human complaint and used data to execute a highly practical business objective. OK, I see the mechanics of how that works in a localized scenario. That makes total sense. But I have to push back here for a second because this brings up a massive issue with scope. OK, weigh on me. Well, when you realize that your internal systems are structurally flawed, the human instinct is to overhaul everything immediately. I mean if your company is bleeding money or losing staff left and right across multiple departments, moving slowly feels kind of irresponsible.
Why not just RIP the Band-Aid off and revamp the whole system at once? What's fascinating here is that overhauling an entire organizational system based on an untested hypothesis is actually one of the fastest ways to bankrupt a company. Wait. Really bankrupt? Oh absolutely. This is where we need to introduce the concept of micro validating. Dearborn and Swanson make it incredibly clear that your directive should be to start with modest, highly contained analytics projects before you ever attempt to scale a solution.
Even if the house is literally on fire. Especially if the house is on fire. Think about it. If you rush in with a brand new, completely untested chemical fire retardant, and it turns out that specific retardant is highly flammable when mixed with the materials in your house, you haven't solved. The problem? You've basically just thrown gasoline. You've accelerated the catastrophe. Microvalidating is essentially risk management. You have to prove the concept in a quarantined environment to ensure your interpretation of the data is actually correct.
Let's walk through the mechanics of that because I want to make sure you, the listener can actually apply this. The book is a really good scenario about a project manager at a marketing firm, right? Yes. So in this case, the overarching goal is massive. They want to increase the efficacy of all the firm's advertising campaigns. That is an intimidating, systemic goal. Where do you even start? Well, rather than analyzing every single campaign the firm has run over the last like five years and trying to rewrite the global strategy, you run a microvalidation.
You review the performance statistics of just one recent campaign, and more importantly, you isolate a single independent variable to test. Like AB testing the ad copy. Exactly. You keep the target audience, the budget, the time of day and all the visual assets completely identical. The only thing you change is the text of the ad, and when you run that isolated test you discover that tweaking the copy in a specific way increases the click through rate by 15%. A 15% bump in marketing is a massive win.
It really is. But the real value isn't just the extra clicks on that one campaign, is it? The real value is that you have mathematically proven the correlation. Yes, you validated the strategy in a low risk environment. Now you can safely and confidently expand that exact copywriting strategy to improve the overall firm's performance. You established credibility through an early localized success, and you gathered accurate information that you can now bet the farm on. Without the massive risk of overhauling everything blindly.
I love the elegance of that. Right. You quarantine the variable, you prove the concept, and then you scale. It's the only Safeway to do it. So let me throw a wrench into this. Yeah, because scaling a single metric without looking at the broader environment seems incredibly dangerous to me. Like what if that 15% bump was just a fluke based on something you didn't measure? That is a very real danger, and it connects directly to the next major concept in the book, which is the necessity of actively listening and looking behind the curtain, right.
This is perhaps the most critical analytical skill a leader can develop. We can call it the context imperative. Statistics sitting alone in a vacuum do not provide a whole picture. In fact, isolated statistics are notorious for lying. They can tell you whatever you want them to tell you. Exactly. You absolutely must tie your internal facts to external circumstances to make them actionable. The rule of thumb The author's present here is a question every leader must make a habit of asking. What is the story behind these numbers?
That question is your primary safeguard against reactionary leadership. Let's examine the retail store scenario provided in the text. It really shows how a lack of context destroys profit margins. Walk us. Through it. So you are managing a retail store, you pull your quarterly report and the sales data indicates a sharp notable decline. OK, if I am just looking at my internal sales dashboard, my immediate panic thought is that we have a cost problem. I'm going to assume our prices are too high or a competitor is undercutting us.
My gut reaction is to slash prices to drive volume. And that is the trap of the isolated metric. A surface level look leads to a surface level solution. If you just blindly slash prices, you are directly cannibalizing your own profit margin. Ouch. And worse, you might find that even with the massive discount, sales are still dropping. Wait, why would they still drop? Because you didn't map your internal metric against external contacts. Right. You have to look variables outside the spreadsheet. Yeah, Things like team performance, customer feedback, market conditions, or even just changes in consumer behavior.
And, crucially, the supply chain. If you investigate the broader context of that sales drop, you might discover that your competitor didn't suddenly get better and your prices aren't actually too high. You might find out that a container ship was delayed at a port for three weeks. Oh. Wow. Yeah, your most popular products were simply out of stock. The customers walked in with their wallets open, ready to pay full price, but there was literally nothing on the shelves for them to buy. So if I had executed my gut reaction and slashed prices, I would have just been losing money on the few random items I did have left in the backroom.
Exactly. While doing absolutely nothing to solve the actual shipping delay that was causing the revenue bleed in the 1st place. That is terrifying. It happens more often than you'd think. Context mapping prevents fatal misunderstandings. It forces you to treat the underlying root mechanics of a problem rather than blindly reacting to the superficial symptoms. OK, so we've seen how micro validating works for marketing and we understand how context mapping saves physical supply chains. But I want to pivot to the messiest part of any organization, the.
People. The people. How does this highly rigid, logical tool apply to the emotional, human side of a company? Dearborn and Swanson make a really fascinating argument here. The data is a potent instrument for enhancing corporate culture. They talk about creating and carrying out state plans. Which is a huge paradigm shift for many executives. I mean, we tend to think of human emotion and company culture as completely unquantifiable. Yeah, here's where it gets really interesting. We usually think of culture as just vibes.
You walk into an office and it either feels energetic or it feels tense. We assume you can't measure vibes the way you measure quarterly revenue. But you can, and if you want and retain top talent, you must. The process starts by collecting information on employee engagement through targeted surveys. But, and this is a massive caveat regarding survey design, if you send out a poll that just asks are you happy at work, you are going to get useless qualitative complaints. A data-driven survey evaluates specific operational pillars of the culture.
Give me an example of the difference. What does that actually look like? Well, instead of asking if they are happy, you ask. Do you receive clear, actionable feedback from your direct manager, or do you have the necessary software tools to complete your daily tasks without relying on unauthorized workarounds? Those questions generate structural data from human emotion that makes. Total sense you're identifying the structural friction points that create the bad vibes in the 1st. Place exactly. The book uses the example of a tech company CEO who runs these highly targeted internal polls.
The data comes back highlighting severe deficiencies in teamwork. The numbers show that different departments feel completely siloed from one another. And because the data is structural, the CEO's response is structural. They don't just send out a passive aggressive company wide e-mail mandating everyone to, you know, be more collaborative. Or just throw a mandatory pizza party and call it a day. Right, the dreaded pizza party. No, they use the data to fundamentally re architect the communication methods.
They implement fresh project management software that forces cross department visibility, and they restructure the weekly standup meetings based on where the data showed the absolute weakest links. And the proof of this strategy is in the follow up, right when the CEO resurveys that exact same workforce a few months later. The data shows a quantifiable increase in collaboration. And because they map the context, they can directly correlate that improved morale with improved project outcomes and faster delivery times.
Think about how empowering that is. You are no longer guessing what will make your team productive. You are treating the emotional architecture of your culture with the exact same strategic rigor you apply to your finances. It's incredibly powerful, but this introduces the final and frankly, the most difficult hurdle in the entire framework. Oh, because you can build the perfect architecture, you can deeply understand the context, and you can have all these brilliant cultural metrics at your fingertips, but absolutely none of it matters if your team flat out refuses to participate.
The human element strikes again and this brings us to the crucial lesson of overcoming organizational resistance. Let's be honest, people are frequently and sometimes aggressively reluctant to adopt data-driven decision making. The resistance is rooted in basic human psychology. Change inherently feels threatening, But when that change involves introducing new dashboards, tracking software and analytical metrics, employees often feel like they are being micromanaged. Like Big Brother is watching.
Exactly, They feel like their hard earned intuition is being ignored and they are being reduced to just a cell and a spreadsheet. So what does this all mean for you, the listener, when you face a wall of skepticism from your colleagues? Like you've done the work. You come into the Monday morning meeting with your microvalidations and your context maps, and your team just crosses their arms, rolls their eyes, and tells you that this isn't how we do things here. How do you actually breakthrough that?
The biggest mistake you can make in that moment is trying to philosophize about the objective beauty of data. You cannot mandate adoption through corporate talking points. You must prove personal benefit. Prove personal benefit. Yes, people will only embrace a new, intimidating process when they can clearly see how it removes friction from their own daily lives. You have to show them that the data works for them, not the other way around. The authors offer a perfect closing scenario to illustrate this change management strategy.
Picture a retail employee working the floor. They notice a persistent decline in sales in their specific department. Instead of just shrugging it off and blaming the overall economy, they decide to use a data-driven approach. They dig into the inventory metrics to pinpoint exactly which specific ski use are failing to move. They are isolating the variable. Exactly. They discover the specific issue, they map it against competitor pricing, they adjust the price on those exact items, and boom, they generate a 15% bump in sales for their department.
But the critical step for overcoming resistance happens next. They do not keep that victory to themselves. They share this specific localized success story with the Wider Spectacle team. And suddenly, the conversation changes. The skeptics see that the new analytics system didn't just result in more administrative busy work for them. It resulted in a targeted action that boosted sales by 15%. Which is huge. Yeah, and if you work on a retail floor, a 15% bump translates directly into better commissions or more favorable shift scheduling or simply a more secure job.
It proves personal benefit. Celebrating those small, verifiable achievements dispels the ambient doubt in the room. It proves that the data is a tool for empowerment, not surveillance, and that establishes the critical credibility you need to roll out broader data initiatives across the entire company in the future. It all comes full circle right back to micro validating. You quarantine the variable, you get that small win, you prove it works, and you use that undeniable success to win over the crowd.
Exactly. So as we synthesize this entire journey, becoming a data-driven leader is not about staring at a spreadsheet until your eyes cross. It is about acting like an audio engineer. You take that massive chaotic file of raw organizational noise, and you use an equalizer to isolate the specific signals that align with your business goals. You start small to manage risk, you map those internal metrics against external context to avoid fatal misunderstandings, you apply structural data to fix your company culture, and you use tangible, localized wins to overcome human resistance.
It's. A complete toolkit. It really is. And what is truly empowering about this framework from the data-driven and leader is that it equips you to be a significantly more capable executive, regardless of your title or your current level of technical experience. You do not need a background in advanced data science to start asking better questions today. I couldn't agree more. So as we leave the overwhelming noise of that crowded stadium behind, I want to leave you with a final lingering question to ponder if adjusting a single variable can reveal the hidden truth of a collapsed supply chain, and if structural surveys can uncover the silent, actionable frustrations of your team.
Wait, no ellipses. Let me rephrase that. If data can reveal the hidden truth of your supply chain and the silent frustrations of your team, what is the most vital everyday metric in your own life that you have been completely ignoring simply because you haven't taken the time to measure it?
 Apple Podcasts
 Castbox
 Castro
 Goodpods
 Moon FM
 Overcast
 Pocket Casts
 Podbean
 Podcast Addict
 Podcast Republic
 Spotify