Financial Intelligence by Mastering the Art of Business Numbers
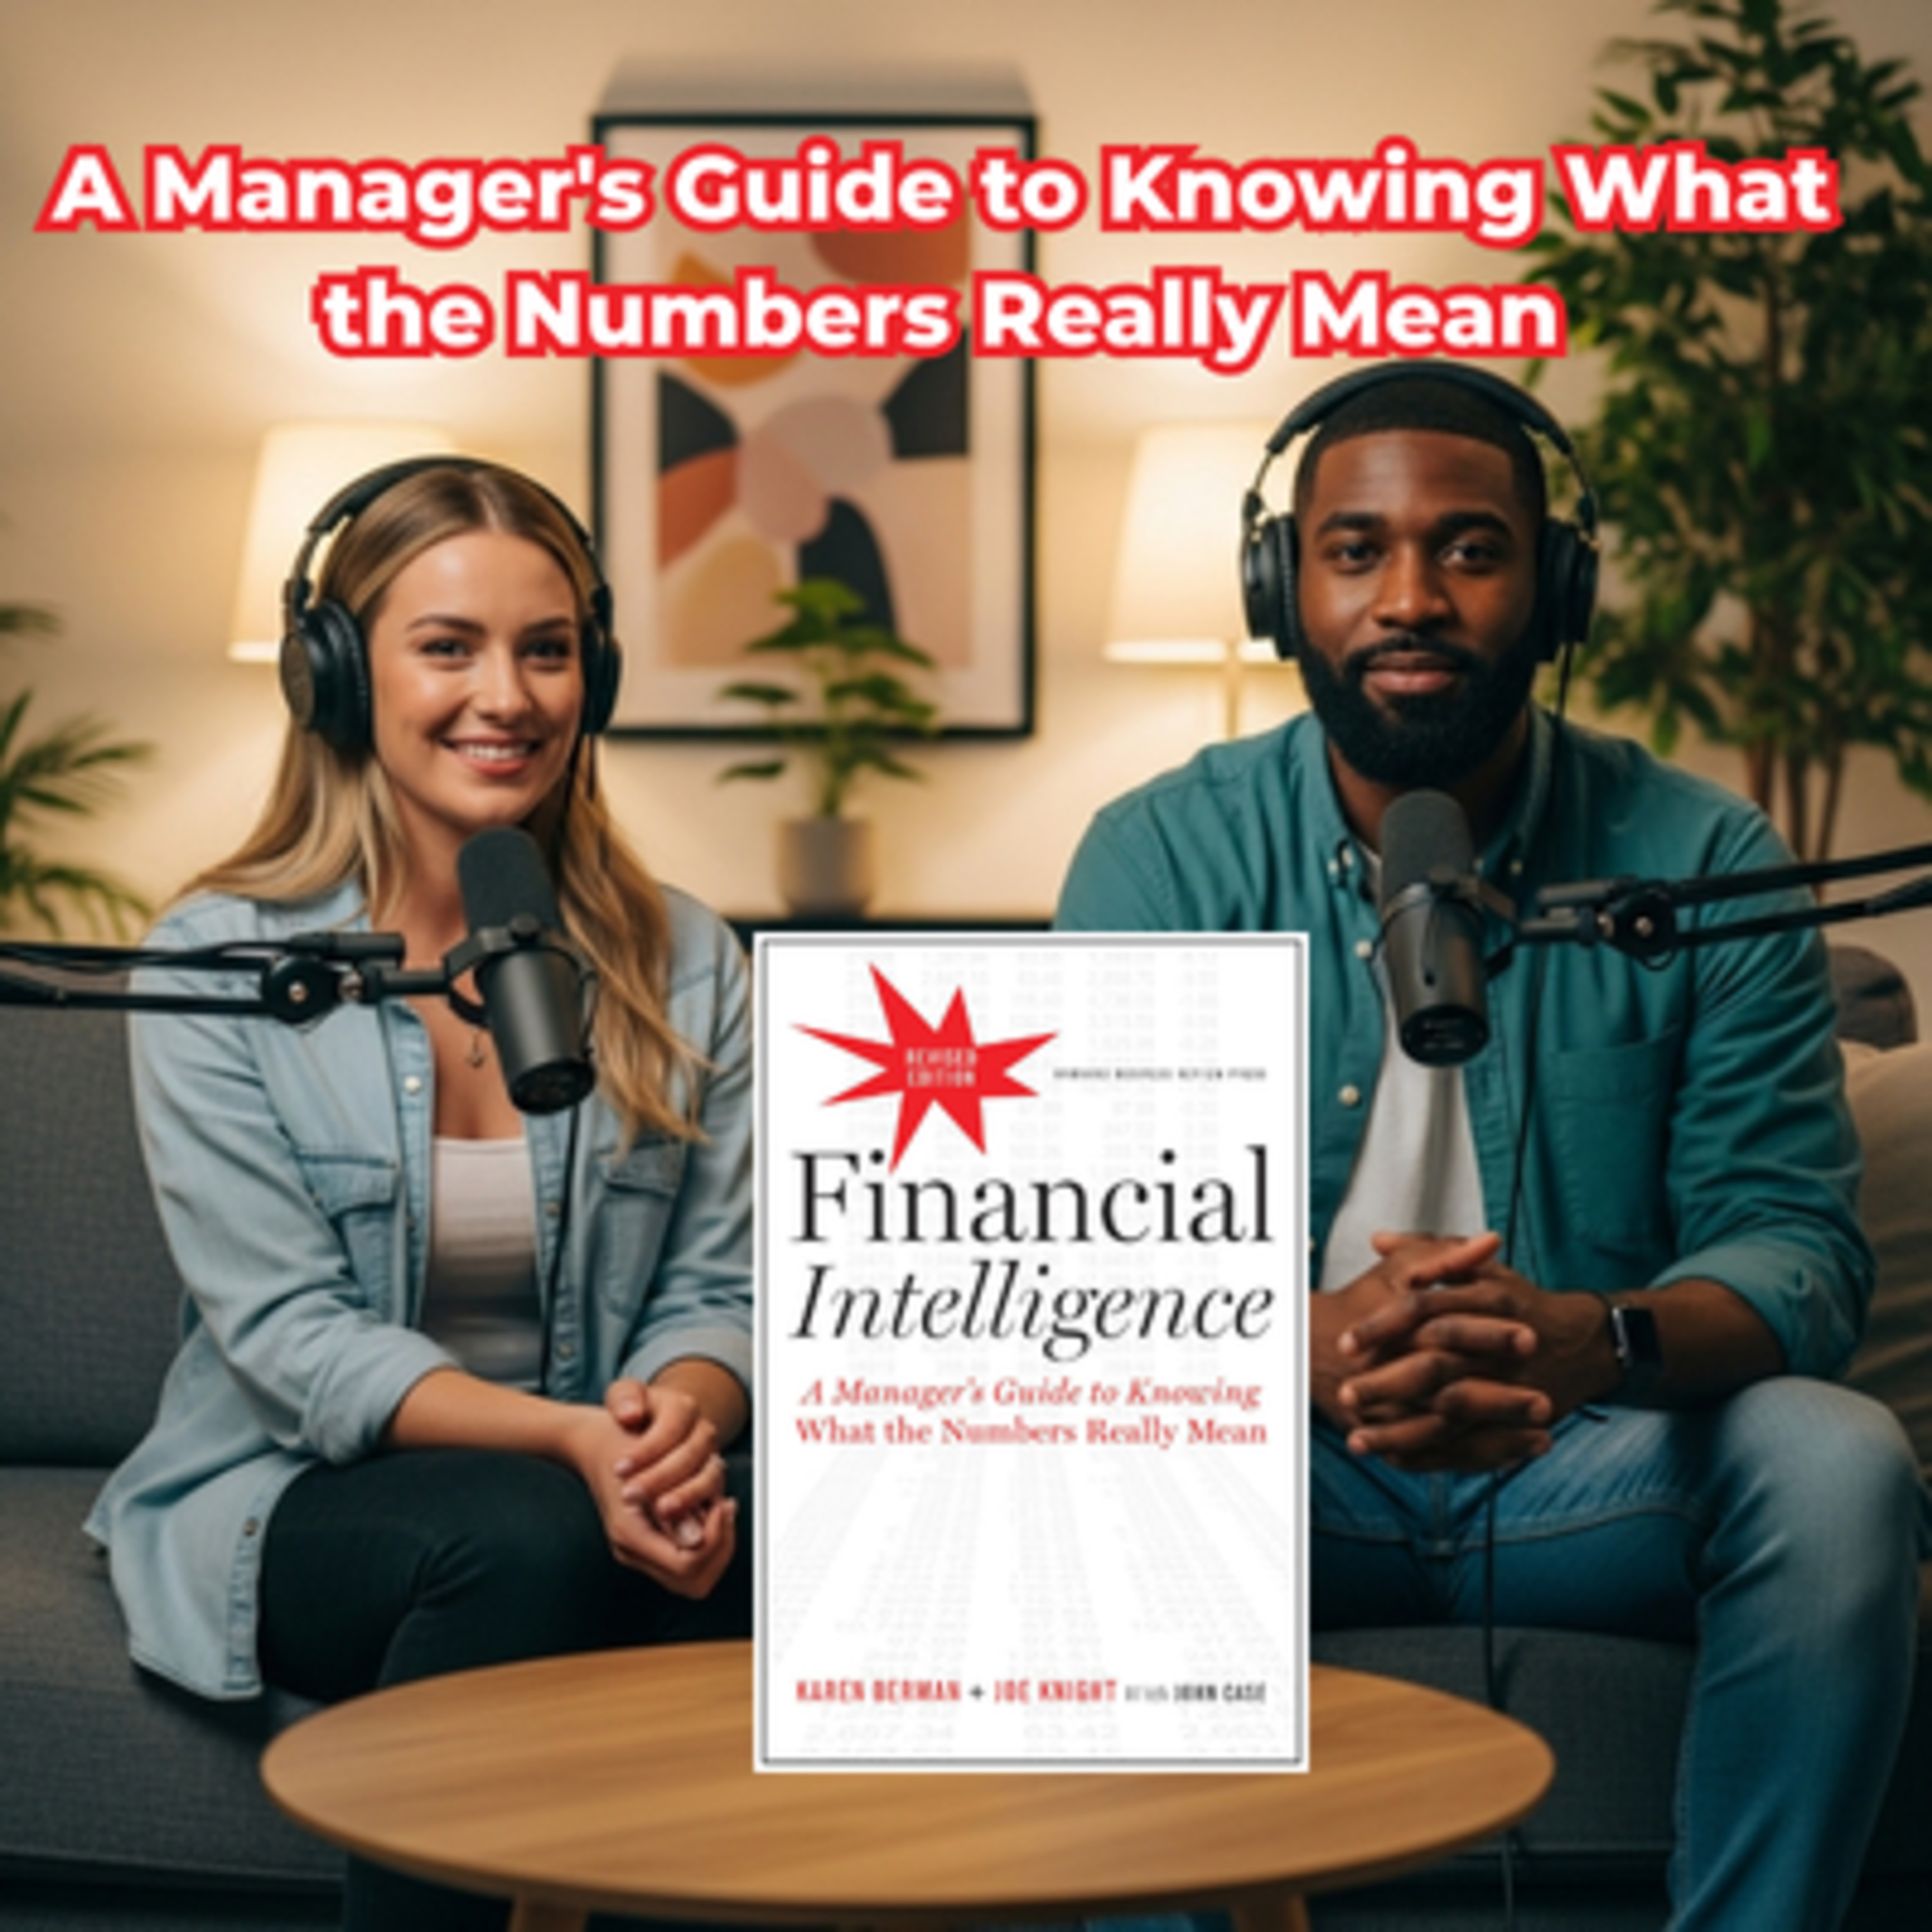
The episode outlines the core principles of financial intelligence, emphasizing that business numbers are often based on subjective estimates and assumptions rather than absolute facts. By understanding the "art" behind financial reporting, managers can identify potential biases and look beyond surface-level data to see a company’s true fiscal health. The chapters explain how various accounting methods impact the interpretation of income statements, balance sheets, and profit calculations. Developing this literacy allows leaders to make informed strategic decisions, improve internal communication, and avoid common financial pitfalls. Ultimately, the source positions financial fluency as a critical professional tool that empowers non-accountants to manage resources and operations more effectively.
The book Inc. magazine calls one of "the best, clearest guides to the numbers" on the market.
Inc. magazine calls it one of "the best, clearest guides to the numbers" on the market. Readers agree, saying it's exactly "what I need to know" and calling it a "must-read" for decision makers without expertise in finance.
Since its release in 2006, Financial Intelligence has become a favorite among managers who need a guided tour through the numbers--helping them to understand not only what the numbers really mean, but also why they matter.
This new, completely updated edition brings the numbers up to date and continues to teach the basics of finance to managers who need to use financial data to drive their business. It also addresses issues that have become even more important in recent years--including questions around the financial crisis and those around broader financial and accounting literacy.
Accessible, jargon-free, and filled with entertaining stories of real companies, Financial Intelligence gives nonfinancial managers the confidence to understand the nuance beyond the numbers--to help bring everyday work to a new level.
#productivityhacks #personaldevelopment #successstrategies #businessinsights #leadershipskills #leadership #ambitiousprofessionals #businesstips #self help #scaling business #businesstactics #professionaldevelopment #startupgrowth #entrepreneurship #businessmindset #growthstrategies
Picture this. You're sitting in a Tuesday morning strategy meeting. The coffee is lukewarm, the room is, you know, a little too quiet, and someone slides this 50 page packet across the conference table to you. Oh. Yeah, we have all been there. Right. And it's just this dense black and white print out of the quarterly financial report, just rows and rows of numbers, acronyms you only half remember, and a bottom line that everyone else in the room is just, like nodding at. Have you ever felt that sudden cold wave of panic?
Yeah. That intense fear that you're the only person who has absolutely no idea what any of it means. Exactly. It's so intimidating. It's a. Wildly universal corporate experience. Because, you know, you look at a spreadsheet, and because it's math, because it's printed in a very serious font, you just assume it represents this absolute, unshakable reality. Right, because 2 + 2 is 4. The math math is the math. Exactly. The natural human inclination is to trust the grid. You assume those numbers are cold hard facts.
Well, today we are going to completely shatter that assumption. We're doing a deep dive into a really detailed summary of the book Financial Intelligence, Mastering the Art of Business Numbers by Karen Berman, Joe Knight, and John Case. It is such an eye opening book. It really is, and the mission for this deep dive is to basically demystify these intimidating documents. We're going to take that that number induced panic you feel at the conference table and turn it into a literal career superpower.
Because, as the sources make incredibly clear, understanding finance is not just for the accountants in the backroom anymore, no. Not at all. It's for anyone who wants to make smarter decisions, spot opportunities and honestly, most importantly, avoid being misled. Yeah. And the most vital step in avoiding being misled is understanding the greatest secret of the financial world. It's the foundational concept of the book, and I mean it's right there in the title, The Art of Business Numbers. Right, which sounds crazy at first.
It does, because when you read a financial statement, you are not looking at a perfect objective reflection of reality, you're looking at a highly subjective narrative. It's a story built on human choices, estimates, and honestly, a staggering amount of bias. Yeah, calling finance and art feels almost dangerous, But reading through our sources, the analogy that immediately came to mind was looking at a highly curated social media feed. Oh, that's a great way to put it, right? Like when you see someone's vacation photos online, you instantly know to ask yourself, OK, what filter did they use to make the water look that blue and more importantly, like what's cropped out of the frame?
Exactly. It sounds like the authors are telling us to apply that exact same skepticism to a corporate income statement. They absolutely are the filters and the cropping. In finance, they come in the form of accounting methods and assumptions. The source material emphasizes that financial statements are basically fundamentally imperfect because they rely so heavily on guesses about future events. Guesses in official financial reports. Yes. Think about an estimate for future revenues, or trying to figure out how much a piece of factory equipment is actually worth after you've used it for three years.
There is no magical mathematical formula that gives you a perfect answer there, right? It involves human beings looking at a very murky future and just making a judgement call. OK. But let me push back on that for a second because, you know, we constantly hear about gap generally accepted accounting principles and strict regulatory compliance. So if the rules, yeah, if a company is publicly traded, there are auditors analyzing their every move. So how much art and guesswork can there really be before an executive is, you know, just committing fraud and going to jail?
That's a fair question. The regulatory frameworks are very real. But think of those rules like the boundaries of a sports field. OK, you can't step out of bounds without getting a penalty, right? But within those lines, you have an enormous amount of strategic freedom in how you play the game. I see. Management teams have to make numerous judgement choices just to compile these facts. Consider something as simple as
bad debt. Bad debt. Yeah. So a company knows that a certain percentage of its customers are simply never going to pay their bills. That's just business. So they have to estimate that percentage and subtract it from their expected revenue. So if management assumes, let's say 2% of their customers will default, their projected profit probably looks pretty fantastic. Exactly. But if they assume 5% will default, that profit shrink significantly and absolutely nothing about the day-to-day business has actually changed.
Wow, so it's literally just the story they choose to tell? Yes, which introduces the element of reporting bias. Human beings compiled these reports, and human beings have incentives. The sources point out that financial data can be deliberately presented to look better to investors or to creditors. Oh, of course, if a manager's year end bonus is tied to hitting a specific profit margin, and they have to make a subjective estimate about that bad debt, human nature dictates they might lean toward the optimistic 2%.
Guess right? Oh totally, they want that bonus. Right. Conversely, if the goal is to lower the company's tax burden for a really highly profitable year, they might suddenly become very pessimistic. They'll assume a higher default rate just to shrink the taxable profit. That is wild. So if you're just looking at the final number on the page, you are completely blind to the human incentives that shaped it. 100% blind. Well, if we know these numbers have a subjective filter applied to them, we need to know how to read the actual document where these filters are used.
According to the sources, the ultimate canvas for this art, the document that tells the story of a company's performance over a time frame, is the income statement. Yes, the income statement. And to decode it, we first have to separate 2 concepts that are honestly constantly treated as synonyms in everyday conversation. Revenue and profit. Exactly. Yeah, the sources make a really sharp distinction. Year revenue is just the total income from sales. It is every single dollar walking in the front door.
But profit is what's actually leftover after the business tracks its expenses. I used to think of it like a personal paycheck, but I think that oversimplifies things. Instead, let's look at it like a leaky bucket. A leaky bucket. I like that. Yeah. So revenue is the hose pouring water into the top of the bucket. But as that water travels down, different departments and obligations are basically drilling holes in the side, draining the water out what is left at the very bottom. That little puddle, that's your profit.
And understanding exactly where those holes are drilled is where financial intelligence really begins. Because profit isn't just a single bottom line number. It takes 3 distinct forms on the income statement and each one tells a completely different story. Right, let's walk through those 3 phases of profits, starting at the top of the bucket. OK, so the first one is gross profit. To find gross profit, you take your total revenue and you subtract something called COGS, the cost of goods sold. COD GS.
OK, so COD GS is the very first leak in the bucket, and this represents the literal physical cost to make the thing you're selling like the raw materials. Yes, exactly. Or the direct labor involved in manufacturing it. Like if you're building smartphones, your COD GS would include the glass screens, the microchips, and the wages of the assembly line workers. Got it. When you subtract those direct costs from your revenue, you are left with gross profit. And this metric is vital because it reveals how efficiently a company is producing its core goods or services.
OK, so if a company is bragging about record-breaking revenue, but their gross profit is actually shrinking, that's a massive red flag. Oh, huge red flag. Because it means their manufacturing process is getting too expensive, or the raw materials are eating them alive, and no amount of sales volume is going to fix a fundamentally broken production model. Exactly. You are diagnosing the health of the supply chain just by looking at that first line of profit. But you know a company isn't just an assembly line.
You have a marketing team running ad campaigns, a corporate office with rent and utility bills, and IT department with software subscriptions. Which brings us to the second leak in the bucket, operating profit, which is also known as operating income. So you take that gross profit we just talked about and you subtract all those operating expenses. This feels like the ultimate report card for the corporate headquarters. It really is. It isolates the performance of the business operations from outside financial factors.
It basically tells you how well the core business is actually being managed day-to-day. Makes sense because you could have a brilliant smartphone design and a highly efficient manufacturing process resulting in a fantastic gross profit. But if the executive team is bleeding money on lavish corporate retreats, unnecessary administrative layers or bloated marketing, your operating profit will be abysmal. OK, let's make this practical. If I'm an HR director and I want to pitch a new expensive employee Wellness program to the execs, I need to understand that this cost is going to drill another hole directly into the operating profit.
So if the operating profit is already dangerously thin, my proposal is going to be seen as a threat to the company's survival, regardless of how good it is for employee morale. That's. Exactly it. Understanding that metric completely changes how I need to frame my pitch. Yes, because you are no longer just asking for a budget. You're evaluating the structural integrity of the business before making a request. You're speaking their language. Wow. OK, so what's the bottom of the bucket? The final leak To get to net profit, you take your operating profit and subtract taxes owed to the government and interest payments on any debt the company holds.
OK, so taxes and debt. Right. This is the truest reflection of profitability because it accounts for absolutely every cost of doing business. It is the final overall financial health of the organization. Let's summarize the bucket real quick. Revenue is the water pouring in. Gross profit tells us if we're building the product efficiently. Operating profit tells us if we're running the corporate headquarters efficiently, and Met profit tells us if the whole endeavor is actually making money after the government and the banks take their cut.
A. Perfect summary, but here. Is the critical pivot in the source material. Understanding those three types of profit is only half the battle. Because of the subjectivity we talked about earlier, companies can pull very specific levers to completely alter the size of those leaks. Yeah, welcome to the mechanics of the numbers game. Let's get into it. Management has two massive levers they can pull to legally manipulate financial outcomes, and those are timing and categorization. Let's look at the timing lever first, which the financial world calls revenue recognition.
Right. Revenue recognition. This addresses the question of when a business officially records its revenue on the books. So if I sign a massive, I don't know, $120,000 contract today for a client to use my company software for the next 12 months, human nature makes me want to claim all that success right now in January. Oh, of course. You want to show your boss that you brought in 120 grand this month? Yeah. But the sources suggest that doing that is actually a huge accounting trap. It is a trap that brings down a lot of fast growing startups.
Because if you recognize all of that money as revenue in January, you are artificially inflating your profits for that month, right? The problem is that you still have to pay the cost of providing that software, server space, customer support, bug fixes for the next 11 months. So if you claim all the revenue upfront, January looks like a massive triumph. Pop and champagne. Exactly. But from February through December, you're going to look like you were operating at a heavy loss because you have steady operating expenses with no new revenue coming in to offset them.
That perfectly explains the accounting principle of matching revenue and costs with the book highlights Roer Accounting requires matching the revenue with the related costs of generating it. Yeah, O the accurate way to handle that software contract is to recognize 100000 of revenue each month for 12 months, matching it against the monthly server and support costs. But returning to the art of finance, different industries have vastly different interpretations of when a service is truly delivered and when revenue can be recognized.
Oh, interesting. Yeah, a construction company building a multi year skyscraper recognizes revenue very differently than a retail store selling a pair of shoes. Recognizing revenue too early inflates current profits to look good for investors today, but recognizing it too late under states performance may be to delay a tax burden. So manipulating the calendar is one way to paint a prettier picture. But what if the issue isn't when the money comes in, but how you hide the money going out? That brings us to the categorization lever, which focuses on the difference between a cost and expense and a capital investment.
This is a huge 1. The categorization of money leaving the business dramatically impacts reported profits. Let's look at how a company might treat a massive output of cash. Imagine a commercial bakery needs to expand so they purchase a massive industrial oven for $50,000. OK, 50 grand. If they categorize that as an immediate operating expense, their profit for that specific month is going to just plummet, right? The leak in the bucket would be so big that they might show a negative operating profit, making the bakery look like it's failing.
Exactly. But that oven is not a fleeting expense like an electric bill. It's going to be used to bake bread and generate revenue for the next 10 years. It's an asset that provides long term value. Rights and investment. So accounting rules allow the bakery to categorize the oven as a capital investment rather than an immediate expense. They put the oven on their balance sheet as an asset and they spread the expense out over the useful life of the equipment Which. Is called depreciation. Yes. So instead of a $50,000 hit all at once, maybe they take a $5000 expense every year for 10 years.
Conceptually, depreciation. That makes logical sense. It prevents a company from looking artificially bankrupt just because they bought new equipment. But this is where the artistic subjectivity creeps back in, right? Oh, absolutely. Because who dictates that the oven will last exactly 10 years? The management does. Wow. So what if the bakeries management decides the oven has a useful life of 20 years? Now they're only claiming a $2500 depreciation expense each year. Yes. By simply changing an assumption about the lifespan of an asset, they have halved their annual expense for that equipment.
Their reported operating profit for the year magically increases, that is. Wild. They haven't baked a single extra loaf of bread. Nope. They haven't found a cheaper supplier for flour. They haven't improved their operations at all. They just pull a categorization lever. That's the art. And that single lever completely reframes how you have to look at corporate success, which leads directly into one of the most crucial chapters in the book, Chapter 4. And it makes this bold claim. Profit is an opinion, but cash is a fact.
Profit is an opinion, but cash is a fact. That phrase just hits hard. It is the absolute bedrock of financial survival. Because of all these levers, the depreciation methods, the revenue recognition, categorization of expenses, reported profit is often a manipulated narrative, right? Cash flow, however, is a biological reality. You either have the money in the bank to make payroll on Friday or you don't. Cash does not care about your clever depreciation schedule. Let's play out a scenario to see how this actually breaks a company because I think this is where people get really caught off guard.
Let's say a manufacturing firm recognizes $1,000,000 in revenue this quarter. OK, on the income statement, they are wildly profitable. Executives are thrilled, but they sold all their products to retailers on 90 day payment terms. So the revenue is recognized, but the actual cash hasn't arrived yet? Exactly. So where does that $1,000,000 go? It sits on a different document called the Balance Sheet, categorized as Accounts Receivable, which is essentially just a giant pile of IOU's. Pile of IOU's, yeah.
The income statement says the company is rich, but the balance sheet reveals they have almost no actual cash on hand. And you cannot pay your warehouse workers with an IOU. No, you can't. You. Can't pay your utility bill with accounts receivable. So this company, which is showing record-breaking profits on its income statement, could literally go bankrupt next week because they experience a cash crunch and default on their obligations. This is exactly why the authors urge readers to look beyond the income statement.
You have to analyze the balance sheet and the cash flow statement. The balance sheet is a snapshot of what the company actually owns, its assets, its cash, its inventory versus what it owes in liabilities, right? If you see accounts receivable skyrocketing while cash plummets, you are looking at a profitable company that is suffocating that. Is such a vivid way to put it. The swap has also emphasized looking at the footnotes of these reports too, which sounds incredibly boring, but apparently it's crucial.
It is where all the secrets are buried. Footnotes reveal the specific accounting policies a company is using. They tell you if the company has suddenly changed, how they calculate depreciation or how they recognize revenue. Because consistency in reporting is the only way to accurately compare financial performance over time. If they change their methods from one year to the next, they're basically obscuring the actual trajectory of the business. Yes. And understanding all of this, the why behind the numbers brings us to the ultimate application of this deep dive.
Why does you know an engineering manager or an IT director or a marketing lead need to master these concepts? Right. Why should you care? Chapter 3 and the book's conclusion make the compelling case that financial intelligence is not just defensive, it is a strategic weapon. Yeah, if you can read the story behind the numbers, you anticipate problems, problems before they become catastrophic. If you're a department head and you look at the balance sheet and you realize the company's record profits are tied up and accounts receivable while the cash reserves are draining, you know cash crunch is coming.
You see it before anyone else. Exactly, you can adjust your departmental budget, delay non essential hiring, and prepare yourself before the executives ever announce a company wide freeze. Furthermore, it dramatically enhances your communication with the finance team. The CFO and the finance department are trying to steer the corporate ship, but they rely on operational data from the people on the ground. Right when you understand the difference between a capital investment and an operating expense, you stop submitting naive budget requests that get instantly rejected.
You start speaking the language of the executives. You align your departmental strategies directly with the companies broader financial goals. Yes, you transition from being a passive recipient of a budget to an active participant in driving the business forward. You go from feeling that wave of panic when the 50 page packet is handed to you to being the person who leans forward in the meeting and asks are we confident in our cash flow given the sudden spike in accounts receivable? Which is the power move.
It really is, yeah. You become the most dangerous and valuable person in the room simply by knowing how the art is painted. It changes your entire trajectory within an organization. But, and this is something that's been on my mind, if we step back and look at the broader implications of this entire system, OK, all of this reliance on human judgment estimates and, you know, art raises a rather profound question about the future of the global economy. Where are you going with this? Well, we've spent this time establishing that financial reports are narratives, right?
Shaped by subjective choices and human biases. Yet we are currently entering an era where artificial intelligence algorithms are being given unprecedented control over financial markets. Wall Street is increasingly relying on AI for algorithmic trading and automated investment strategies. But what are those algorithms training on? Financial Statements. Exactly. They're ingesting decades of these highly subjective filtered financial statements to predict market trends. Oh. That is terrifying. So the question we really must grapple with is this.
What happens to the global economy when hyper logical, lightning fast AI systems are basing their entire understanding of reality on financial data that is fundamentally built on human guesswork? Are these machines actually learning the objective truth of the market, or are they simply learning to execute our accounting biases at a terrifying scale? That is wow, that is a lot to think about. So you know, the next time you look at that dense 50 page packet, ask yourself that the algorithm's reading it.
No, it's just a painting. Thanks for taking this deep dive with us.
 Apple Podcasts
 Castbox
 Castro
 Goodpods
 Moon FM
 Overcast
 Pocket Casts
 Podbean
 Podcast Addict
 Podcast Republic
 Spotify